|
|
|
L. David Shen1 , Jian Huang2 and Fang Zhao3
ACKNOWLEDGEMENTS This study is partially supported by the National Urban Transit Institute (NUTI) and U.S. Department of Transportation. Their support is gratefully acknowledged. However, the statements and opinions expressed in this paper are the sole responsibility of the authors. |
Automated people mover (APM) systems consist of automated, electric-powered, driverless vehicles operated singly or in multi-car trains on steel or concrete guideways. APM systems provide a high quality of service and are capable of moving between 2,000 to 25,000 passengers per hour per direction. Over the past two decades, APM technology has been extensively used for circulation service in airports, recreational parks and central business districts. APM technology has also been used for trunk line transit service, such as the VAL system in Lille, France, and the SkyTrain in Vancouver, Canada, both of which are significantly successful. This paper attempts to conduct a worldwide review of APM applications for urban transit and airport circulation services to obtain a full understanding of the costs, benefits, capabilities and efficiencies of this advanced transit technology. It may be concluded that APM systems are a suitable mode of high level-of-service for trunk line transit service in a medium population area and for circulation services in major activity centers such as airports, recreational and central business district areas.
: Automated People Mover, Level-of-Service, Capital Cost, Mass Transit, Guideway Transit System, Airport.
Over the last two decades, the automated people mover (APM) is one of the most significant developments in transit technology. APMs can carry from 2,000 to 25,000 passengers per hour per direction with headways as short as 60 seconds and even shorter than this for small APM systems, offering convenience comparable to riding modern elevators. The ride quality for APMs is among the best of any transit system in the world. APM vehicles travel at speeds up to 90 km/h (56 mph) and accelerate and decelerate smoothly and swiftly. The vehicles, which are typically comprised of cars of urban transit bus size, stop and start automatically, and they can operate in an on-demand mode during off-peak hours to minimize energy consumption or maintain a good service frequency to reduce passengers' waiting time without incurring too much operating expenses. Besides, APM systems have also kept an excellent record of reliability and safety.
APMs have been extensively operated within restricted major activity centers such as airports, entertainment and educational complexes, large retail and employment centers and urban central business districts (CBD). There have been over fifty airport APM applications worldwide. APMs have their obvious advantages, which include high ride quality, short headways, flexibility in operation, excellent reliability and safety records, etc. APM technology has also been used for trunk line transit services, such as the SkyTrain in Vancouver, Canada, and the VAL system in Lille, France, both of which are significantly successful. Today, one sixth of all transit passengers in the Vancouver region use the SkyTrain for all or part of their daily trip. In other words, the SkyTrain carries 35 million passengers annually at a rate of 110,000 trips per day, making it in the last decade, one of the most heavily used rail transit systems in North America (BC 1994). The VAL system in Lille, France is also an example of a successful line haul APM applications in Europe. In 1993, the Lille VAL system carried 50 million passengers; 230,000 daily on working days. In addition, the farebox recovery ratio of the VAL system is 120 percent, which means it is profitable (The VAL Metro). For the Vancouver SkyTrain the ratio is about 100% (Interview 1994). Some of the line haul APM systems presently in operation or under construction are listed in Table 1.
| System | Status | Length (miles) | No. of Stations | No. of Vehicles | Line Capacity (pphpd) |
| Ankara Metro, Turkey | UDC1 | 9.4 | 12 | 108 | -2 |
| Docklands, England | Operating | 16.7 | 35 | 80 | 15,600 |
| Bordeaux, France | UDC | 6.2 | 16 | 64 | - |
| Lille, France | Operating | 15.7 | 36 | 83 | 24,000 |
| Lyon, France | UDC | - | - | - | - |
| Mexico City SkyTrain | UDC | 13.1 | 27 | 60 | - |
| Rennes, France | UDC | 5.6 | 15 | 16 | - |
| Toulouse, France | Operating | 6.2 | 15 | 29 | - |
| Turin, Italy | UDC | 5.6 | 16 | 34 | - |
| Vancouver SkyTrain, Canada | Operating | 17.9 | 19 | 130 | 25,000 |
| Taipei, Taiwen | UDC | 7.2 | 12 | 102 | 24,000 |
| Yamanote Chiba | Operating | 5.0 | - | - | 1,900 |
| Kokura Kitakyusyu | Operating | 5.2 | - | - | 4,800 |
| Kobe Portliner, Japan | Operating | 4.0 | 9 | 72 | 10,800 |
| Kobe Rokkoliner, Japan | Operating | 2.8 | - | - | 10,000 |
| Yokohama, Japan | UDC | 6.7 | 14 | 95 | 4,300 |
| Osaka, Japan | UDC | 4.1 | 8 | 60 | 5,000 |
| Hiroshima, Japan | UDC | 11.4 | - | - | 4,000 |
Note:
1 UDC stands for underconstruction
2 - indicates not available
The objective of this paper is to conduct a worldwide review of APM applications for urban transit and airport circulation services to obtain a full understanding of the costs, benefits, capabilities, and efficiencies of this advanced transit technology. In the urban transit area, the Lille VAL, the Vancouver SkyTrain, the Declineds Light Railway in England, and the Miami Metromover will be examined. The SK system in Charles De Gaulle (CDG) International Airport in Paris, France, the APM system in New Denver International Airport and the APM system in Newark International Airport, New Jersey will be reviewed as representatives of airport APM systems. The review of these represented APM systems will be focused on their costs, benefits, capabilities and efficiencies.
The VAL system in Lille, France, was the first line-haul APM system in the world. Shown in Exhibit 1, the existing system is 25.3 km in length and has 34 stations. The line capacity of the system is 24,000 passengers per hour. Lille is an old, dense, multi-centered metropolitan area, located in the north of France. It is the fourth largest urban area in the country, with a population of 1.1 million in an area of 600 sq-km.
Exhibit 1 The VAL System in Lille, France

The Lille VAL system was initially conceived as a link to connect the old city with the new town where the new University of Lille campus is located. The decision was made to choose APM technology because of its capacity to provide frequent service while occupying a smaller space. Options to expand the highway were considered, but rejected as being too costly and disruptive to the historic city center. Heavy rail was also considered, but unjustifiable due to the density of the area. In 1993, the Lille VAL system carried 50 million passengers at a rate of 230,000 daily on weekdays (The VAL Metro). Many existing heavy rail systems in the world carry less people than the Lille VAL system.
Greater Vancouver, a metropolitan area located on the west coast of Canada, has a population of about 1.6 million and an area of 640 sq-km. It has a strong, active downtown, low density suburbs with some medium density clusters, many highway bottlenecks and few freeways. In 1980, theSkyTrain system, shown in Exhibit 2, was initiated to provide an alternative to the automobile and bus along a long-established corridor, to channel metropolitan growth into an efficient transit oriented corridor. Additionally, the SkyTrain was built to serve crowds and as a demonstration of new technology for Expo86, whose theme was transportation.
Exhibit 2 The SkyTrain in Vancouver, Canada
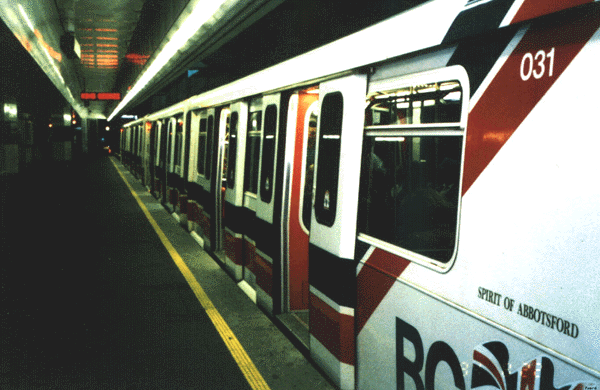
The Vancouver SkyTrain was the first line-haul APM transit system in North America. The first phase of the SkyTrain was opened in 1986; Subsequently, two extensions opened in 1990 and 1994. The system is 28.8 km in length and has 20 stations. The line capacity of the system is 25,000 passengers per hour. The SkyTrain system has integrated its fare and operating schedules with the Seabus at the Waterfront station and buses at all stations. In FY94, 35.8 million passenger-trips were made on the SkyTrain at a rate of 133,000 weekday passenger-trips (BC 1994).
The Docklands Light Railway (DLR) was initiated by the idea to regenerate Docklands by stimulating real estate redevelopment in this formerly derelict area. The DLR system is also to provide a low volume, low cost but high quality transit linkage into the London Underground and commuter rail networks. The initial system had 15 stations and a length of 12 kilometers, opened in August 1987. The currently existing DLR network consists of four legs radiating from Poplarwhere the head office, control center and engineering facilities are located. Automatically controlled trains, in distinctive blue, white and red livery, run at frequent intervals. The DLR serves parts of the East End of London and London Docklands north of the River Thames. Exhibit 3 shows a DLR train and station platform.
Exhibit 3 Docklands Light Railway System in London, England
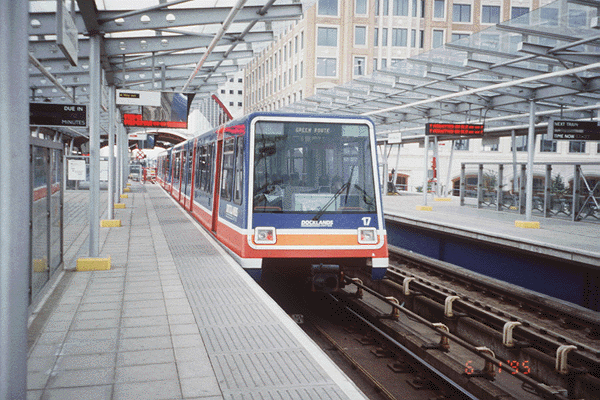
The Railway is operated by Docklands Light Railway Limited: Until March 1992 a wholly-owned subsidiary of London Regional Transport, and now part of the London Docklands Development Corporation. A typical DLR train has a capacity of 284 passengers. The minimum designed headway is two minutes. The current service headway is 10 minutes.
As part of the Metropolitan Dade County Transportation Improvement Program, the Metromover was built to provide a means for downtown circulation and serve as a downtown feeder for Metrorail, the heavy rail system (Goldberg and Potter 1985). Construction began in June 1983, and the system opened in May 1986 as the first APM in a downtown setting, with 1.9 miles of double track and 10 stations. The total system cost in 1986 dollars is $159 million, or $83.2 million per mile.
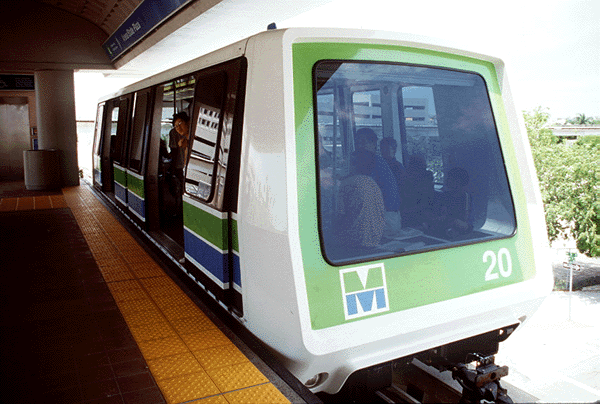
In May 1994, a new extension of the Metromover was opened. The extension adds additional 12stations and 2.5 miles of track to the existing system. The extension is mostly double track and is divided into two legs. The Brickell leg is to the south and consists of six stations and 1.1 miles. The other leg, known as the Omni leg, has its own six stations and 1.4 miles of track. The entire system now consists of 4.4 miles of track and 22 stations and connect to the rapid rail at two locations. The extension costs a total of $228 million (or 91.2 million per mile), 35% of which pays for the guideway and station construction and another 27% is for the vehicles, controls and designs to AEG Westinghouse. Since the opening of the extension in May, daily ridership has increased to 12,500, close to the predicted 13,000. Exhibit 4 shows the Miami Metromover system.
Exhibit 4 Miami Metromover at a Station
The SK system in Paris Charles De Gaulle (CDG) International Airport, France, consists of Lines 1 and 2, which will be opened for service in 1996 and 1997, respectively. Line 1 has a length of 3,500 m and five stations while Line 2 has a length of 800 m and three stations. The hourly capacity per direction will be 2,900 persons in the initial stage and 5,000 persons in the final stage. Minimum headway will be 36 seconds in the initial stage and 21 seconds in the final stage. Exhibit 5 shows the SK train in CDG airport.
SK systems are comprised of a series of cars (a maximum of 30 passengers per car) is pulled by a cable which continuously circulates at a top speed of 20 mph. The minimum headway between eachcar is 17 seconds. The cars remain in continuous movement. Upon entering stations, the cars detach from the main circulating drive cable, but do not come to a complete stop. They continue to move along the boarding platform at a very low speed (less than one foot per second, or three times slower than the circulating speed of a moving sidewalk) for passenger boarding and exiting. Turntables located at each terminus allow cars to change track and direction in a very limited space. According to experts, the SK system is a suitable passenger transportation system for distances ranging from one thousand feet (305 m) to three miles (4827 m) (SK 1994).
Exhibit 5 Sk System in CDG International Airport, Paris

The $5 billion new Denver International Airport (DIA) was opened in February 1995. The 34,000 acre, five runways, 94 gates, 13,000 parking spaces airport is projected to handle 34 million passengers in its opening year and will have the capacity to serve up to 110 million passengers and 1.2 million aircraft operations annually by 2020. As the first major airport built in the U.S. in more than 20 years, DIA represents the state-of-the-art in airport design. From the automated underground train between the terminal and concourses, to the 5,300 mile web of fiber-optics communication system that covers the whole airport, to the most advanced air traffic control system in the world, every piece of this airport was designed to make passenger's journey as convenient and efficient as possible.
The nerve center for the entire airport is a 6,200 feet tunnel that contains the automated transitsystem and the baggage handling system. The transit system, provided by AEG Transportation Systems, includes 16 C-100 vehicles, automatic train control and a power distribution system. The APM system has the capacity to transport 12,000 passengers an hour between the airport's main landside terminal and its three airside concourses. Exhibit 6 shows the platform and screen door of the APM system.
Exhibit 6 Platform and Screen Door for APM System in DIA, Denver
The estimated $350 million 1.9 miles Monorail system in Newark International Airport is expected to reduce vehicular traffic significantly in the Central Terminal Area by eliminating the numerous on-airport car rental, inter-terminal and parking lot bus operations on the circulating roadways and terminal frontages. The system will provide fast, convenient transportation among the airport's three terminals Parking Lots D and E, and car rental facilities.
The monorail system will consist of fully automated, computer-controlled trains operating on a 1.9 miles long, dual-lane, bi-directional guideway. Passengers will access the system from any one of seven stations: three in Parking Lot D; on each in Terminals A, B and C; and one in Parking Lot E. Fully accessible to all riders including those with restricted mobility. The system will have a capacity of 2,600 passengers per hour between any two stations in each direction, with a waitingtime at any station of less than two minutes during peak periods. 24-hour operations a day, 365 days a year will be implemented after this automated monorail system is completed in October 1995.
he Newark International Airport monorail system is provided by AEG Monorail Systems, Inc. (AMS) including the design and construction of the guideway; fabrication of all vehicles; design and installation of the train controls; communication, propulsion and power distribution systems; and all equipment with the maintenance and control facility. The total fleet for this system will be 12 trains, each train consisting of 6 cars initially or 7 cars ultimately. Accordingly, the passenger capacity of a train will be 78 persons initially and 90 persons ultimately.
System characteristics of the four urban transit and three airport circulation APM systems are summarized in Table 2.
The capital cost data for each system, as shown in Table 3, was converted to 1994 U.S. dollars with adjustments for time and currency conversion. It should be noted that the capital costs of the airport APM systems do not include the land costs, which may be 5 ~ 10% or more of the total capital cost Additionally, it should be mentioned that airport APM systems have smaller vehicles and lighter guideway.
In order to have a understanding of APM costs compared with those of rapid rail and light rail transit systems, the Washington, D.C., Atlanta, Baltimore and Miami RRT systems are selected based on availability of cost data while the LRT systems in Buffalo, Pittsburgh, Portland and Sacramento are selected to represent LRT systems. Table 4 gives the capital cost ranges and averages of RRT, LRT and urban APM systems. The idea that APMs are expensive may be somewhat of a misperception. The capital costs for APM systems fall between those of LRT and RRT systems. This is very logical
| System | Lille Val | Vancouver | London DLR | Miami | Paris CDG | Denver Airport APM | Newark Airport APM | |
| Supplier | MARTA | UTDA | GEC/Mowle | AEG | Soule | AEG | AEG | |
| Start Up | 1983 | 1986 | 1987 | 1986 | 1996 | 1995 | 1995 | |
| Technology | rubber tire, third rail | steel wheel, third rail, LIM | steel wheel, third rail | rubber tire, third rail | steel wheel, cable-drawn | steel wheel, third rail | monorail | |
| Guideway Length | Total | 25.3 km (15.7 mi) |
28.8 km (17.9 mi) |
27.0 km (16.7 mi) |
7.1 km (4.4 mi) |
4.3 km (2.7 mi) |
2.9 km (1.8 mi) |
3.1 km (1.9 mi) |
| Underground | 68% | 4% | 12% | 0% | 0% | 100% | 0% | |
| Elevated | 26% | 86% | 83% | 100% | 100% | 0% | 100% | |
| At-Grade | 6% | 10% | 5% | 0% | 0% | 0% | 0% | |
| No. Stations | Total | 36 | 20 | 35 | 21 | 8 | 7 | 7 |
| Avg. Spacing | 0.7 km (0.4 mi) | 1.4 km (0.9 mi) | 0.7 km | 0.3 km | 0.5 km | 0.4 km | 0.4 km | |
| Fleet Size | 83 two-car sets | 130 | 80 | 29 | 79 | 16 | 12 | |
| Maximum Speed | 80 km/h (50 mph) |
90 km/h (56 mph) |
80 km/h (50 mph) |
กก | 36 km/h (line speed) |
กก | 43.4 km/h (27 mph) |
|
| Minimum Headway | 60 sec | 90 sec | 120 sec | 60 sec | 21 sec | 60 sec | 60 sec | |
| Train Consists | 2, 4 cars | 2, 4, 6 cars | 2 | 1, 2 cars | 1 | 2 | 6, 7 cars | |
| Car normal capacity (psn) | 72 (34 seats) | 75 (40 seats) | 210 (84 | 100 | 29 | 100 | 13 | |
| Car Crash Capacity (psn) | 100 | 100 | 260 | 155 | 29 | 100 | 13 | |
| Line Capacity (pphpd) | 24,000 | 25,000 | 15,600 | 12,000 | 5,000 | 12,000 | 5,400 | |
and reasonable as APM systems, generally speaking, have better levels of service than LRT systems while the capacity of an APM system, even as a trunk line service, is less than that of a RRT system. The average capital cost for airport APMs are less than that of LRT systems.
| System | Year built | Cost in year built | Cost in 1994 US dollars | Route Length (km) | No. stations | Car/Train Capacity (persons) | Per km cost in 1994 US dollars |
| Lille VAL | 1983: phase 1 1984: phase 1b 1989: line 2 |
'87US$6501 '87US$5671 |
$1,664 | 25.3 | 36 | 100/400 | $65.8 |
| Vancouver SkyTrain | 1986: phase 1 1990: ext. 1 1994: ext. 2 |
US$6152 US$1452 Can$1272 |
$1,133 | 28.8 | 20 | 100/600 | $39.4 |
| London DLR | 1987: phase 1 1991: ext. 1992: ext. 1993: ext. |
'87?773 '91?278 '92?248 '93?46 |
$1,152 | 27.0 | 35 | 260/260 | $42.7 |
| Miami Metromover | 1986 1994: ext. |
US$159 US$228 |
$492 | 7.1 | 21 | 100/200 | $69.3 |
| Paris CDG Airport APM | 1996 | $1004 | $100 | 4.3 | 8 | 29/29 | $23.2 |
| Denver Airport APM | 1995 | $1495 | $149 | 2.9 | 7 | 100/100 | $51.4 |
| Newark Airport APM | 1995 | $3506 | $350 | 3.1 | 7 | 13/80 | $112.9 |
Note: 1 Source: EcoPlan STS - Lille Case Study Report, 19990 (EcoPlan 1990b)
2 Source: EcoPlan STS - Vancouver Case Study Report, 1990 (EcoPlan 1990a)
3 Source: Docklands Light Rail
4 Source: Fabian 1993
5 Source: Fabian 1993
6 Source: Information Fact Sheets from the Port of Authority of NY&NJ, April 1995
APM systems may be operated at very short headways in peak hours, commonly capable of aheadway of 60 seconds or less, and can travel at a high speed as permitted by the alignment geometry and the distance between stations. Additionally, the service frequency of the APM systems can be maintained in an accepted level in off-peak hours without incurring considerable operating costs, because of their driverless feature. The reduction of passengers' waiting time during off-peak hours is essential in providing the quality of transit service and attracting more choice passengers.
(in 1994 US Dollars)
| System | Range | Cost per Route Kilometer ($million) |
| Rapid Rail Transit Systems | Average | $96.2 |
| Low | $52.7 | |
| High | $140.0 | |
| Light Rail Transit Systems | Average | $42.3 |
| Low | $12.1 | |
| High | $93.0 | |
| Urban APMs | Average | $54.3 |
| Low | $39.4 | |
| High | $69.3 | |
| Airport APMs | Average | $62.5 |
| Low | $23.2 | |
| High | $112.9 |
APM systems have perhaps the best level of service compared to all other guideway modes. Because of the precisely controlled speed, acceleration, and deceleration, they offer excellent rider quality. The reliability and availability of APM systems are also the highest among the guideway transit family. These are what makes APM systems the most popular choice for airport internal circulation in the world. In airports, large volume of passengers as well airline workers need to be transported between the main entrance(s) to the terminals. Any delay in transportation may cause considerable loss to airlines and the airport. APM systems are therefore chosen for the level ofservice they are able to provide. For other applications, such levels of service are also desirable.
Service quality, reliability and safety are three very important system performance characteristics. The high service quality of APM systems has been proven and widely accepted. This includes their high ride quality, short headway and flexible service frequency. The system reliability records for the Lille VAL and Vancouver SkyTrain systems are shown in Table 5. Table 6 reveals the safety records for these two APM systems along the averages for LRT and RRT systems for comparison. This data shows that on average, the two line-haul APM systems are more safer than LRT and RRT systems.
| System | Reliability (% runs on-time within 4 min.) |
Year recorded |
| Vancouver SkyTrain1 | 99.6% | 1993/94 |
| Lille VAL2 | 99.5% | 1993 |
Note: 1 Source: MATRA: VAL 1983-1993
2 Source: BC Transit, requested technical data form
| System | Incidents | Injuries | Fatalities |
| Vancouver SkyTrain1 | 0.028 | 0.000 | 0.0002 |
| Lille VAL3 | 0.028 | 0.000 | 0.000 |
| LRT Systems4 | 0.393 | 0.305 | 0.001 |
| RRT Systems4 | 0.124 | 0.110 | 0.001 |
Note: 1 Based on the operating statistics in 1986/87 (EcoPlan 1990a)
2 One woman fell between cars (7/88), and one person killed before SkyTrain was opened for service
3 Based on the operating statistics in 1989 (EcoPlan 1990b)
4 Statistics for RRT and LRT systems were obtained in Shen et al (1995)
Safety is a major concern during the design and operation of any transit system. For APM systems, safety is even more important as there are normally no operators nor conductors onboard to handle emergency situations. Passenger safety is ensured by fail-safe vehicle control systems and other advanced technologies applied to, for instance, door operations.
When compared to RRT and LRT systems, APM systems have kept an excellent record of safety. The detailed data of transit system safety in the U.S. are from Data Table for the 1992 Section 15 Report (FTA 1993). Data for the Vancouver SkyTrain are provided by the BC Rapid Transit Company Ltd.
Figures 1 and 2 show the statistical data of safety, based on per 10,000 vehicle revenue miles and per vehicle in maximum service, respectively. Clearly, APM systems demonstrate a better safety record than the RRT and LRT systems. Most safety incidents, according to staff in the Metro-Dade Transit Agency, which operates the Miami Metromover, are related to passengers slipping on the escalators and platforms.
Conclusions that emerge from this study are as follows:
(1)APM systems may be operated at very short headways in peak hours, commonly capable of a headway of 60 seconds or less. Besides, the service frequency of the APM systems can be maintained in an accepted level in off-peak hours without incurring considerable operating costs because of their driverless feature.
(2)The four urban APMs studied derive a capital cost range between $39.4 and $69.3 million per route kilometer. The costs of APM systems are between those of light rail and rapid rail transit systems. The capacity of a line haul APM system falls between those of light rail and rapid rail systems.
(3)APM systems have superior system performances such as service quality, reliability and safety to the average LRT and RRT systems.
(4)APM systems are a suitable means with high quality of service for circulation in major activity canters such as airports and recreational parks. APM systems are also preferable for urban transit service, when and where medium expected ridership is expected and quality and relatively frequent services are needed even during off-peak hours.
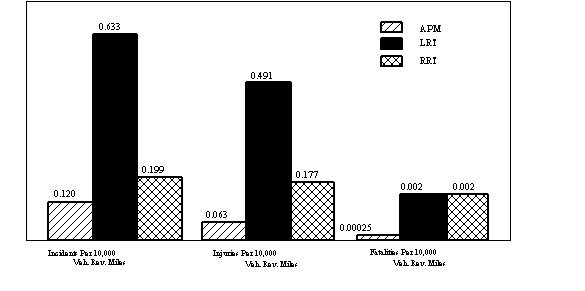
Figure 1. Safety Statistics for Guideway Transit Modes, per 10,000 Vehicle Revenue
Miles
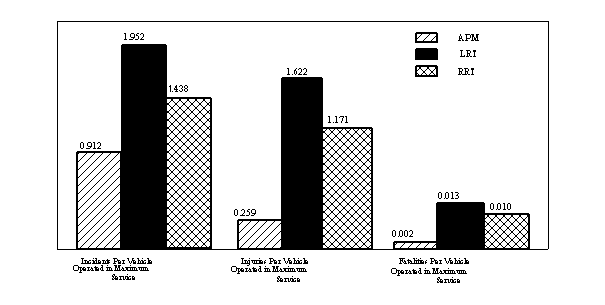
Figure 2. Safety Statistics for Guideway Transit Modes, per Vehicle in Maximum Service
American Public Transit Association (1994). 1994-1995 Transit Fact Book, Statistics.
BC Transit, Transit Fact Sheet, 1994.
EcoPlan International (1990b). Lille's VAL - Case Study, 10 rue Joseph Bara, 75006 Paris, France.
EcoPlan International (1990a). Vancouver SkyTrain - Case Study, 10 rue Joseph Bara, 75006 Paris, France.
EcoPlan International (1990c). Docklands Light Railway - Case Study, 10 rue Joseph Bara, 75006 Paris, France.
FTA, (1993). Data Table - 1992 Section 15 Report.
Furniss, R. E. (1986). "Advanced Light Rapid Transit (ALRT) - The Vancouver Experience. " UTDC Corporation, Detroit, Michigan, October 1986.
Huang, J. and Shen, L. D. (1994). "Intermodal Guideway Public Transit Systems in Lille," Proceedings of Pacific Rim Council on Urban Development Conference, Taipei, Oct. 1994.
Interview with Mr. Ian Graham, the operations manager of the Vancouver SkyTrain, Vancouver, Canada. 1994.
Jane's Urban Transport Systems, Twelfth Edition, 1994-1995, Bushell, Chris (Ed.), Jane's Information Group Inc., 1340 Braddock Place, Suite 300, Alexandria, VA 22314.
MATRA TRANSPORT, the Blooming of Rapid Transit, the Lille Urban Community VAL l 983- 1993.
Mills, D. L. (1985). "Guideway Design & Construction for Vancouver Advanced Light Rapid Transit," Proceedings of a Conference, Automated People Movers: Engineering and Management in Major Activity Centers, E. S. Neumann, and M. V. A. Bondada (eds.), ASCE, Miami, Florida, March 25-28, 657-666.
Navarrete, G. (1994). Metromover Extension Project Cost Control Report, Metro-Dade Transit Agency, Miami, Florida, May 1994.
Pastor, G.J. (1985). "Urban Experience with APM in North America." Proceedings of a Conference, Automated People Movers: Engineering and Management in Major Activity Centers, E. S. Neumann. and M. V. A. Bondada (eds.), ASCE, Miami, Florida, March 25-28, 188-211.
Shen, L. D. and Zhao, F. (1995). Interim Subtask Report: Task 7 - Application of New TechnologiesDeveloping Intermodal Transit Systems, Lehman Center for Transportation Research, Florida International University, Miami, FL 33199.
Shen, L. D., Zhao, F. and Huang, J. (1995). Automation: The Costs and Benefits, the 74th Annual Meeting of Transportation Research Board, Paper No. CP022, Washington, D. C., January 22-28, 1995.
Shen, L. D. (1992). "Implications of Automated People Movers for Airport Terminal Configurations," ITE Journal, February 1992, 25-28.
Swede, G. (1994). "Downtown People Mover (DPM) Systems - Why Are There so Few?", TRB 73rd Annual Meeting, January 9-13, Washington, D.C.
The VAL Metro, the Lille Urban Community.
Scherrer, B. (1993). "Charles De Gaulle Airport People Mover Story," in Automated People Mover IV, Enhancing Values in Major Activity Centers, Irving, Texas, March 18-20, 1993, edited by William J. Sprouts, Edward S. Neumann, and Murthy V.A. Bondada, ASCE.
Fabian, L. J. (1993). "Rationalizing Airport Ground Access," Transportation Quarterly, Vol. 47, No. 4, October 1993: 473-482.
1
Chairman and Director, Department of Civil & Environmental Engineering, Lehman Center for Transportation Research, Florida International University, Miami, FL, 33199.2Research Associate, Lehman Center for Transportation Research, Department of Civil & Environmental Engineering, Florida International University, Miami, FL. 33199
3Assistant Professor,
Department of Civil & Environmental Engineering, Lehman Center for Transportation Research, Florida International University, Miami, FL, 33199.